Archive
Areas of Mathematics
For one of my upcoming talks I am trying to include an exhaustive mindmap showing the different areas of Mathematics, and somehow, how they relate to each other. Most of the information I am using has been processed from years of exposure in the field, and a bit of help from Wikipedia.
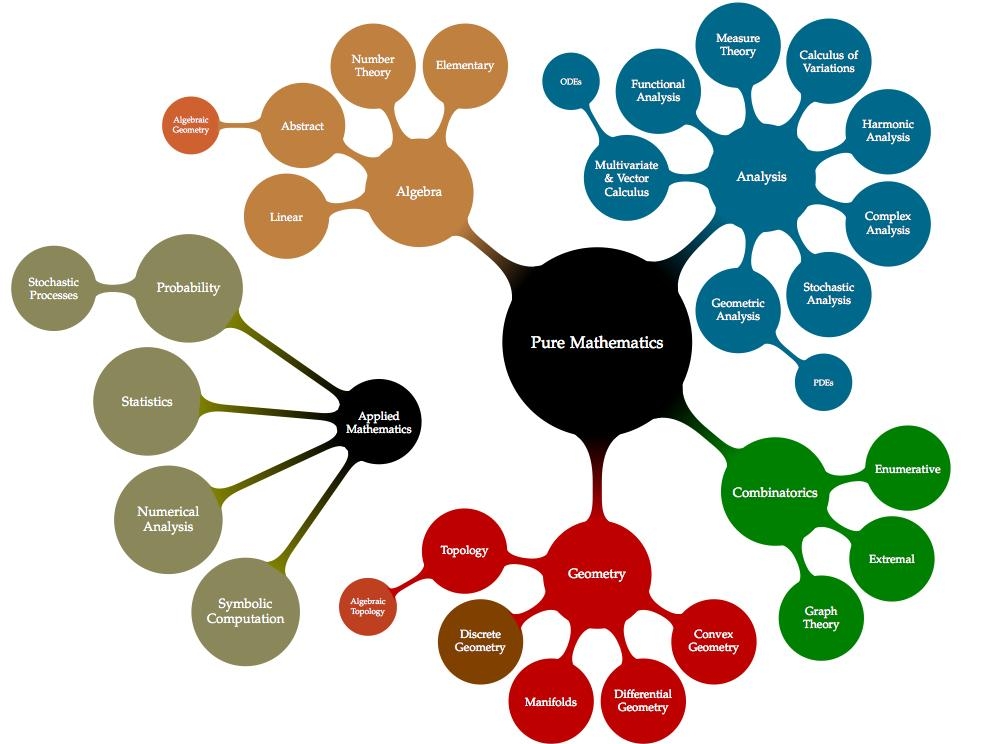
But I am not entirely happy with what I see: my lack of training in the area of Combinatorics results in a rather dry treatment of that part of the mindmap, for example. I am afraid that the same could be told about other parts of the diagram. Any help from the reader to clarify and polish this information will be very much appreciated.
And as a bonus, I included a 
\tikzstyle{level 2 concept}+=[sibling angle=40]
\begin{tikzpicture}[scale=0.49, transform shape]
  \path[mindmap,concept color=black,text=white]
    node[concept] {Pure Mathematics} [clockwise from=45]
      child[concept color=DeepSkyBlue4]{
        node[concept] {Analysis} [clockwise from=180]
          child {
            node[concept] {Multivariate \& Vector Calculus}
              [clockwise from=120]
              child {node[concept] {ODEs}}}
              child { node[concept] {Functional Analysis}}
              child { node[concept] {Measure Theory}}
              child { node[concept] {Calculus of Variations}}
              child { node[concept] {Harmonic Analysis}}
              child { node[concept] {Complex Analysis}}
              child { node[concept] {Stochastic Analysis}}
              child { node[concept] {Geometric Analysis}
                [clockwise from=-40]
                child {node[concept] {PDEs}}}}
          child[concept color=black!50!green, grow=-40]{
            node[concept] {Combinatorics} [clockwise from=10]
              child {node[concept] {Enumerative}}
              child {node[concept] {Extremal}}
              child {node[concept] {Graph Theory}}}
          child[concept color=black!25!red, grow=-90]{
            node[concept] {Geometry} [clockwise from=-30]
              child {node[concept] {Convex Geometry}}
              child {node[concept] {Differential Geometry}}
              child {node[concept] {Manifolds}}
              child {node[concept,color=black!50!green!50!red,text=white] {Discrete Geometry}}
              child {
                node[concept] {Topology} [clockwise from=-150]
                  child {node [concept,color=black!25!red!50!brown,text=white]
                    {Algebraic Topology}}}}
          child[concept color=brown,grow=140]{
            node[concept] {Algebra} [counterclockwise from=70]
              child {node[concept] {Elementary}}
              child {node[concept] {Number Theory}}
              child {node[concept] {Abstract} [clockwise from=180]
                child {node[concept,color=red!25!brown,text=white] {Algebraic Geometry}}}
              child {node[concept] {Linear}}}
    node[extra concept,concept color=black] at (200:5) {Applied Mathematics}
      child[grow=145,concept color=black!50!yellow] {
        node[concept] {Probability} [clockwise from=180]
          child {node[concept] {Stochastic Processes}}}
      child[grow=175,concept color=black!50!yellow] {node[concept] {Statistics}}
      child[grow=205,concept color=black!50!yellow] {node[concept] {Numerical Analysis}}
      child[grow=235,concept color=black!50!yellow] {node[concept] {Symbolic Computation}};
\end{tikzpicture}
Which one is the fake?

|

|

|
“Crab on its back” | “Willows at sunset” | “Still life: Potatoes in a yellow dish” |
Buy my book!
Well, ok, it is not my book technically, but I am one of the authors of one of the chapters. And no, as far as I know, I don’t get a dime of the sales in concept of copyright or anything else.
As the title suggests (Modeling Nanoscale Imaging in Electron Microscopy), this book presents some recent advances that have been made using mathematical methods to resolve problems in electron microscopy. With improvements in hardware-based aberration software significantly expanding the nanoscale imaging capabilities of scanning transmission electron microscopes (STEM), these mathematical models can replace some labor intensive procedures used to operate and maintain STEMs. This book, the first in its field since 1998, covers relevant concepts such as super-resolution techniques (that’s my contribution!), special de-noising methods, application of mathematical/statistical learning theory, and compressed sensing.
We even got a nice review in Physics Today by Les Allen, no less!
Imaging with electrons, in particular scanning transmission electron microscopy (STEM), is now in widespread use in the physical and biological sciences. And its importance will only grow as nanotechnology and nano-Biology continue to flourish. Many applications of electron microscopy are testing the limits of current imaging capabilities and highlight the need for further technological improvements. For example, high throughput in the combinatorial chemical synthesis of catalysts demands automated imaging. The handling of noisy data also calls for new approaches, particularly because low electron doses are used for sensitive samples such as biological and organic specimens.
Modeling Nanoscale Imaging in Electron Microscopy addresses all those issues and more. Edited by Thomas Vogt and Peter Binev at the University of South Carolina (USC) and Wolfgang Dahmen at RWTH Aachen University in Germany, the book came out of a series of workshops organized by the Interdisciplinary Mathematics Institute and the NanoCenter at USC. Those sessions took the unusual but innovative approach of bringing together electron microscopists, engineers, physicists, mathematicians, and even a philosopher to discuss new strategies for image analysis in electron microscopy.
In six chapters, the editors tackle the ambitious challenge of bridging the gap between high-level applied mathematics and experimental electron microscopy. They have met the challenge admirably. I believe that high-resolution electron microscopy is at a point where it will benefit considerably from an influx of new mathematical approaches, daunting as they may seem; in that regard Modeling Nanoscale Imaging in Electron Microscopy is a major step forward. Some sections present a level of mathematical sophistication seldom encountered in the experimentally focused electron-microscopy literature.
The first chapter, by philosopher of science Michael Dickson, looks at the big picture by raising the question of how we perceive nano-structures and suggesting that a Kantian approach would be fruitful. The book then moves into a review of the application of STEM to nanoscale systems, by Nigel Browning, a leading experimentalist in the field, and other well-known experts. Using case studies, the authors show how beam-sensitive samples can be studied with high spatial resolution, provided one controls the beam dose and establishes the experimental parameters that allow for the optimum dose.The third chapter, written by image-processing experts Sarah Haigh and Angus Kirkland, addresses the reconstruction, from atomic-resolution images, of the wave at the exit surface of a specimen. The exit surface wave is a fundamental quantity containing not only amplitude (image) information but also phase information that is often intimately related to the atomic-level structure of the specimen. The next two chapters, by Binev and other experts, are based on work carried out using the experimental and computational resources available at USC. Examples in chapter four address the mathematical foundations of compressed sensing as applied to electron microscopy, and in particular high-angle annular dark-field STEM. That emerging approach uses randomness to extract the essential content from low-information signals. Chapter five eloquently discusses the efficacy of analyzing several low-dose images with specially adapted digital-image-processing techniques that allow one to keep the cumulative electron dose low and still achieve acceptable resolution.
The book concludes with a wide-ranging discussion by mathematicians Amit Singer and Yoel Shkolnisky on the reconstruction of a three-dimensional object via projected data taken at random and initially unknown object orientations. The discussion is an extension of the authors’ globally consistent angular reconstitution approach for recovering the structure of a macromolecule using cryo-electron microscopy. That work is also applicable to the new generation of x-ray free-electron lasers, which have similar prospective applications, and illustrates nicely the importance of applied mathematics in the physical sciences.
Modeling Nanoscale Imaging in Electron Microscopy will be an important resource for graduate students and researchers in the area of high-resolution electron microscopy.
(Les J. Allen, Physics Today, Vol. 65 (5), May, 2012)

|

|

|
| Table of contents | Preface | Sample chapter |
Naïve Bayes
There is nothing naïve about Naïve Bayes—a very basic, but extremely efficient data mining method to take decisions when a vast amount of data is available. The name comes from the fact that this is the simplest application to this problem, upon (the naïve) assumption of independence of the events. It is based on Bayes’ rule of conditional probability: If you have a hypothesis 


where as usual, 


I would like to show an example of this technique, of course, with yet another decision-making algorithm oriented to guess my reaction to a movie I have not seen before. From the data obtained in a previous post, I create a simpler table with only those movies that have been scored more than 28 times (by a pool of 87 of the most popular critics featured in www.metacritics.com) [I posted the script to create that table at the end of the post]
Let’s test it:
>>> len(table)
49
>>> [entry[0] for entry in table]
[‘rabbit-hole’, ‘carnage-2011’, ‘star-wars-episode-iii—revenge-of-the-sith’,
‘shame’, ‘brokeback-mountain’, ‘drive’, ‘sideways’, ‘salt’,
‘million-dollar-baby’, ‘a-separation’, ‘dark-shadows’,
‘the-lord-of-the-rings-the-return-of-the-king’, ‘true-grit’, ‘inception’,
‘hereafter’, ‘master-and-commander-the-far-side-of-the-world’, ‘batman-begins’,
‘harry-potter-and-the-deathly-hallows-part-2’, ‘the-artist’, ‘the-fighter’,
‘larry-crowne’, ‘the-hunger-games’, ‘the-descendants’, ‘midnight-in-paris’,
‘moneyball’, ‘8-mile’, ‘the-departed’, ‘war-horse’,
‘the-lord-of-the-rings-the-fellowship-of-the-ring’, ‘j-edgar’,
‘the-kings-speech’, ‘super-8’, ‘robin-hood’, ‘american-splendor’, ‘hugo’,
‘eternal-sunshine-of-the-spotless-mind’, ‘the-lovely-bones’, ‘the-tree-of-life’,
‘the-pianist’, ‘the-ides-of-march’, ‘the-quiet-american’, ‘alexander’,
‘lost-in-translation’, ‘seabiscuit’, ‘catch-me-if-you-can’, ‘the-avengers-2012’,
‘the-social-network’, ‘closer’, ‘the-girl-with-the-dragon-tattoo-2011’]
>>> table[0]
[‘rabbit-hole’, ”, ‘B+’, ‘B’, ”, ‘C’, ‘C+’, ”, ‘F’, ‘B+’, ‘F’, ‘C’, ‘F’, ‘D’,
”, ”, ‘A’, ”, ”, ”, ”, ‘B+’, ‘C+’, ”, ”, ”, ”, ”, ”, ‘C+’, ”, ”,
”, ”, ”, ”, ‘A’, ”, ”, ”, ”, ”, ‘A’, ”, ”, ‘B+’, ‘B+’, ‘B’, ”, ”,
”, ‘D’, ‘B+’, ”, ”, ‘C+’, ”, ”, ”, ”, ”, ”, ‘B+’, ”, ”, ”, ”, ”,
”, ‘A’, ”, ”, ”, ”, ”, ”, ”, ‘D’, ”, ”,’C+’, ‘A’, ”, ”, ”, ‘C+’, ”]
So you want to be an Applied Mathematician
The way of the Applied Mathematician is one full of challenging and interesting problems. We thrive by association with the Pure Mathematician, and at the same time with the no-nonsense, hands-in, hard-core Engineer. But not everything is happy in Applied Mathematician land: every now and then, we receive the disregard of other professionals that mistake either our background, or our efficiency at attacking real-life problems.
I heard from a colleague (an Algebrist) complains that Applied Mathematicians did nothing but code solutions of partial differential equations in Fortran—his skewed view came up after a naïve observation of a few graduate students working on a project. The truth could not be further from this claim: we do indeed occasionally solve PDEs in Fortran—I give you that—and we are not ashamed to admit it. But before that job has to be addressed, we have gone through a great deal of thinking on how to better code this simple problem. And you would not believe the huge amount of deep Mathematics that are involved in this journey: everything from high-level Linear Algebra, Calculus of Variations, Harmonic Analysis, Differential Geometry, Microlocal Analysis, Functional Analysis, Dynamical Systems, the Theory of Distributions, etc. Not only are we familiar with the basic background on all those fields, but also we are supposed to be able to perform serious research on any of them at a given time.
My soon-to-be-converted Algebrist friend challenged me—not without a hint of smugness in his voice—to illustrate what was my last project at that time. This was one revolving around the idea of frames (think of it as redundant bases if you please), and needed proving a couple of inequalities involving sequences of functions in 
It doesn’t hurt either that the kind of problems that we attack are more likely to attract funding. And collaboration. And to be noticed in the press.
Alright, so some of you are sold already. What is the next step? I am assuming that at his point you own your Calculus, Analysis, Probability and Statistics, Linear Programming, Topology, Geometry, Physics and you are able to solve most known ODEs. From here, as with any other field, my recommendation is to slowly build a Batman belt: acquire and devour a sequence of books and scientific articles, until you are very familiar with their contents. When facing a new problem, you should be able to recall from your Batman belt what technique could work best, in which book(s) you could get some references, and how it has been used in the past for related problems.
Following these lines, I have included below an interesting collection with the absolutely essential books that, in my opinion, every Applied Mathematician should start studying:
Basic Statistics in sage
No need to spend big bucks in the purchase of expensive statistical software packages (SPSS or SAS): the R programming language will do it all for you, and of course sage has a neat way to interact with it. Let me prove you its capabilities with an example taken from one of the many textbooks used to teach the practice of basic statistics to researchers of Social Sciences (sorry, no names, unless you want to pay for the publicity!)
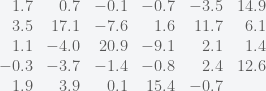
Estimating Mean Weight Change for Anorexic Girls
The example comes from an experimental study that compared various treatments for young girls suffering from anorexia, an eating disorder. For each girl, weight was measured before and after a fixed period of treatment. The variable of interest was the change in weight; that is, weight at the end of the study minus weight at the beginning of the study. The change in weight was positive if the girl gained weight, and negative if she lost weight. The treatments were designed to aid weight gain. The weight changes for the 29 girls undergoing the cognitive behavioral treatment were
Blanco-Silva’s Books
Click on either image for more information


In the news:


 Math updates on arXiv.org
- On the image of the total power operation for Burnside rings
- A note on hidden classes in spinor classification
- Modularity of certain products of the Rogers-Ramanujan continued fraction
- Complex Analytic Structure of Stationary Flows of an Ideal Incompressible Fluid
- Learning the local density of states of a bilayer moir\'e material in one dimension
- Hypergeometric Distribution Revisited: Tail Inequalities, Confidence Bounds and Sample Sizes
- Positive formula for the product of conjugacy classes on the unitary group
- Neural Estimation Of Entropic Optimal Transport
- Some Homological Conjectures Over Idealization Rings
- On kernels of homological representations of mapping class groups
sagemath
- An error has occurred; the feed is probably down. Try again later.
